Garmin Forerunner 201
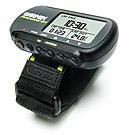
This is my latest toy, a GPS-based pedometer with calorie counting, lap timers, pace and distance alerts, interval training support, basic waypoint navigation, and even an animated “virtual partner” to compete against in a session. It tracks up to two years of workout data, with daily and weekly breakdowns, runs for up to 15 hours on a charge, and can be connected to a PC through the supplied cable.
Garmin supplies free Windows logbook software on their web site, which works under Virtual PC for the Mac with my Keyspan USB Serial Adapter. I don’t know if the Forerunner is compatible with standard GPS-ready mapping software (I’m sure I’ve got some around here somewhere…), but the quite readable XML export at least gives you access to the longitude/latitude and altitude data.
The altitude data is pretty useless, since the Forerunner doesn’t have a barometric altimeter, relying solely on GPS data. For instance, this is the graph of a three-mile walk along the Stevens Creek Trail in Mountain View:

What’s wrong with this picture? The altitude varies from 42 feet below sea level to 35 feet above, along a trail that’s almost completely level. Worse, it’s a round trip, so the second half should be a mirror image of the first.
Since precise altitude isn’t a big deal for the target market, I’m surprised they bothered to graph it in the logbook. Unfortunately, it appears they also use it when calculating calories, inflating the total by around 30% for my sample walk. I’m probably going to file a bug with Garmin over that little flaw.
Apart from that, so far it looks like a worthwhile gadget. The reliance on GPS limits it to outdoor use, so it’s not useful for someone who does most of their walking indoors or around tall buildings that interfere with the signal, but for people who walk, jog, or bike outdoors, it’s got a lot to offer.
Just don’t put too much faith in those calorie counts.
Update: while typing up a bug report for Garmin, I took a closer look at the graph above, and realized that if you apply a curve-fitting function and tilt your head to the side, it actually does look like a mirror image. The problem is that the wild fluctuations in the first half leave it with the impression that the return trip is all uphill, which is reflected in the calorie calculations.
I suspect that if you turned it on and stood still for five to ten minutes, the altitude reading would stabilize enough to make the calorie calculations more meaningful. I’ll try it on my next outing, although I can’t honestly recommend it as a general practice.
Update: Just walked the same trail again, after standing still for at least five minutes to see if the altitude would stabilize. No such luck. In fact, it did worse, recording altitudes ranging from 30 feet below sea level to 82 feet above. The second half was once again less variable than the first, but the high reading was a sudden peak near the end. I think I’d have remembered a hill that rose 37 feet over 100 yards and then immediately dropped 57 feet over another 100 yards, especially since the total elevation change along this trail is about six feet.